Analytics
What Analytics shows you
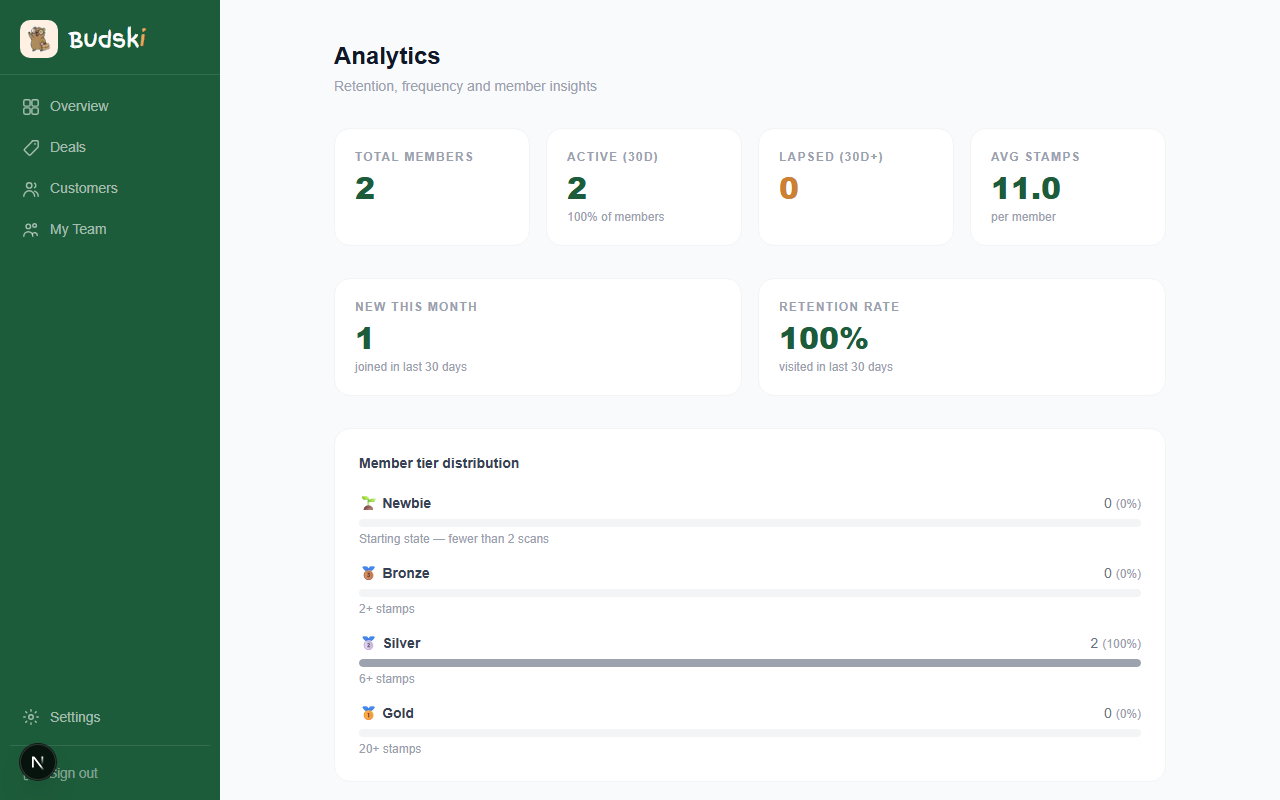
The Analytics page gives you a read on your loyalty programme's health. You do not need to be a numbers person — the page is designed to answer a few simple questions: Are my customers coming back? Am I growing? Who is at risk of drifting away?
The summary figures
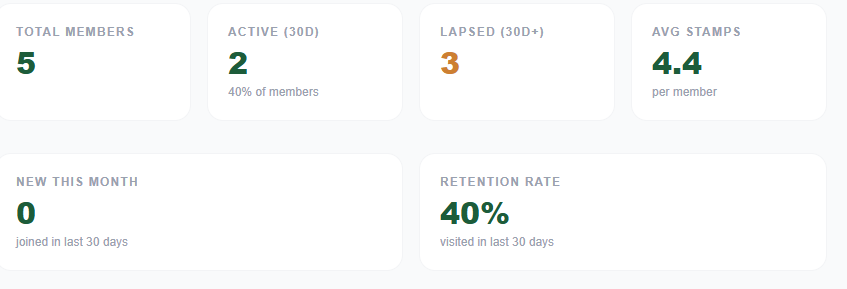
At the top you will see four cards:
- Total members — everyone who has ever scanned your QR code
- Active (30d) — members who visited at least once in the last 30 days
- Lapsed (30d+) — members who have not been in for over a month
- Avg stamps per member — how engaged your typical customer is
Below that, two more: New this month (joined in the last 30 days) and your Retention rate (the percentage of total members who visited recently).
Member tier distribution
This chart shows how your customers are spread across your loyalty tiers. A healthy programme has customers moving up over time. If most are stuck in Newbie, your stamp goal may need adjusting.
Top members
A table of your ten highest-stamp earners, showing their anonymised Adventurer code, current tier, stamp count, and when they last visited.
Lapsed members
★ This feature is available on the Growth plan.
If you have Growth, Budski shows you which specific members have not visited in 30 or more days, with their last visit date. This list is your starting point for a Flash Deal — you know exactly who to try to win back.
On Essentials, you can see the lapsed count but not the individual list.
How to navigate here
Analytics is not in the main sidebar. Access it by clicking the ★ Analytics link on any stat card on the Overview page.
Need help? Email help@budski.co.za